W#12: Collaborative Git, Data Science Projects, Probability
Collaborative Work with Git
Learning goal: First experiences with collaborative data science work with git
Step 1: git clone project-Y-USERNAMES
Team formation is mostly complete. Repositories project-A-USERNAMES, …, project-H-USERNAMES are created. You are to deliver your project reports in your repository.
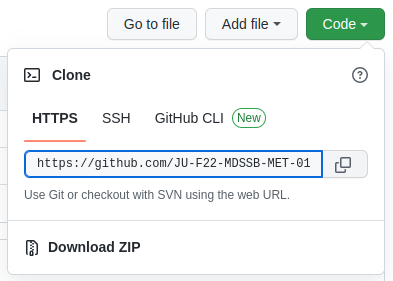
- Go to: https://github.com/orgs/CU-F23-MDSSB-01-Concepts-Tools/repositories
- Find your project repository
- Copy the URL
![]()
- Go to RStudio
- New Project > Form Version Control > Git > Paste your URL
- The project is created
Step 2: First Team member commits and pushes
The first team member1 does the following:
- Open the file
report.qmd - Write your name in the first line at
authorin the YAML git addthe filereport.qmdgit commit(enter “Added name” as commit message)git push
Step 3: Other team members pull
- Do
git pullin the RStudio interface.
What does git pull do?
git pulldoes two things: fetching new stuff and merging it with existing stuff- First it
git fetchs the commit from the remote repository (GitHub) to the local machine - Then it
git merges the commit with the latest commit on your local machine.
- First it
- When we are lucky this works with no problems. (Should be the case with new files.)
Step 4: Merge independent changes
Git can merge changes in the same file when there are no conflicts. Let’s try.
- The second team member:
- Add your name in the author section of the YAML, save the file, add the file in the Git pane and make a commit.
- Save, add the file in the Git pane, commit with message “Next author name”, push.
- The third (or first) team member:
- Change the title in the YAML to something meaningful (and also add your name if third team member), save the file, add the file in the Git pane and make a commit.
- Try to push. You should receive an error. Read it carefully, often it tells you what to do. Here: Do
git pullfirst. You cannot push because remotely there is a newer commit (the one your colleague just made). - Pull. This should result in message about a successfull auto-merge. Check that both are there: Your line and the line of your colleague. If you receive several hints instead, first read the next slide!
??? git configuration for divergent branches
If you pull for the first time in a local git repository, git may complain like this:
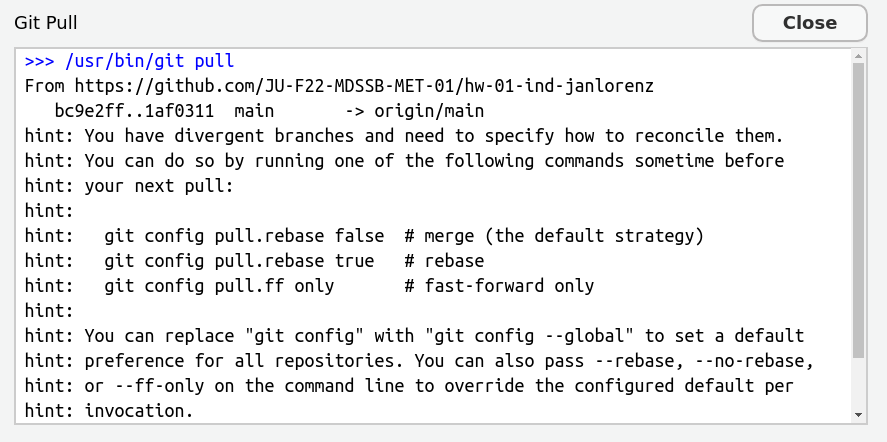
Read that carefully. It advises to configure with git config pull.rebase false as the default version.
How to do the configuration?
- Copy the line
git config pull.rebase falseand close the window. - Go to the Terminal pane (not the console, the one besides that). This is a terminal not for R but to speak with the computer in general. Paste the command and press enter. Now you are done and your next
git pullshould work.
Step 5: Push and pull the other way round
- The third/first member:
- The successful merge creates a new commit, which you can directly push.
- Push.
- The second team member (and all others):
- Pull the changes of your colleague.
Practice a bit more pulling and pushing commits and check the merging.
Step 6: Create a merge conflict
- First and second team members:
- Write a different sentence after “Executive Summary.” in YAML
abstract:. - Each
git addandgit commiton local machines.
- Write a different sentence after “Executive Summary.” in YAML
- First member:
git push - Second member:
git pull. That should result in a conflict. If you receive several hints instead, first read the slide two slides before!- The conflict should show directly in the file with markings like this
>>>>>>>>
one option of text,
======== a separator,
the other option, and
<<<<<<<.
Step 7: Solve the conflict
- The second member
- You have to solve this conflict now!
- Solving is by editing the text
- Decide for an option or make a new text
- Thereby, remove the
>>>>>,=====,<<<<<< - When you are done:
git add,git commit, andgit push.
Now you know how to solve merge conflicts. Practice a bit in your team.
Working in VSCode: The workflow is the same because it relies on git not on the editor of choice.
Advice: Collaborative work with git
- Whenever you start a work session: First pull to see if there is anything new. That way you reduce the need for merges.
- Inform your colleagues when you pushed new commits.
- Coordinate the work, e.g. discuss who works on what part and maybe when. However, git allows to also work without full coordination and in parallel.
- When you finish your work session, end with pushing a nice commit. That means. The file should render. You made comments when there are loose ends and todo’s.
- You can also use the issues section of the GitHub repository for things to do.
- When you work on different parts of the file, be aware that also a successful merge can create problems. Example: Your colleague changed the data import, while you worked on graphics. Maybe after the merge the imported data is not what you need for your chunk. Then coordinate.
- Commit and push often. This avoids that potential merge conflicts become large.
Data Science Projects
A project report in a nutshell
- You pick a dataset,
- do some interesting question-driven data analysis with it,
- write up a well structured and nicely formatted report about the analysis, and
- present it at the end of the semester.
Project Timeline
- Week 12 (this week):
- Decide for the data you will use
- When the dataset is small, you can upload it to your repository
- When the dataset is large, provide download instructions in your report and keep the data only locally
- Write a (tentative) title in your report file
- Write a (tentative) list of ~3 questions you want to answer in your report
- Render, Commit, and Push
- Decide for the data you will use
- Week 13: Work towards answering at least one question
Try to reach a preliminary final step for the work-in-progress presentation - Week 14: Work-in-progress presentation Thu, Dec 7
- Deadline Dec 22: Render, Commit, and Push your final report
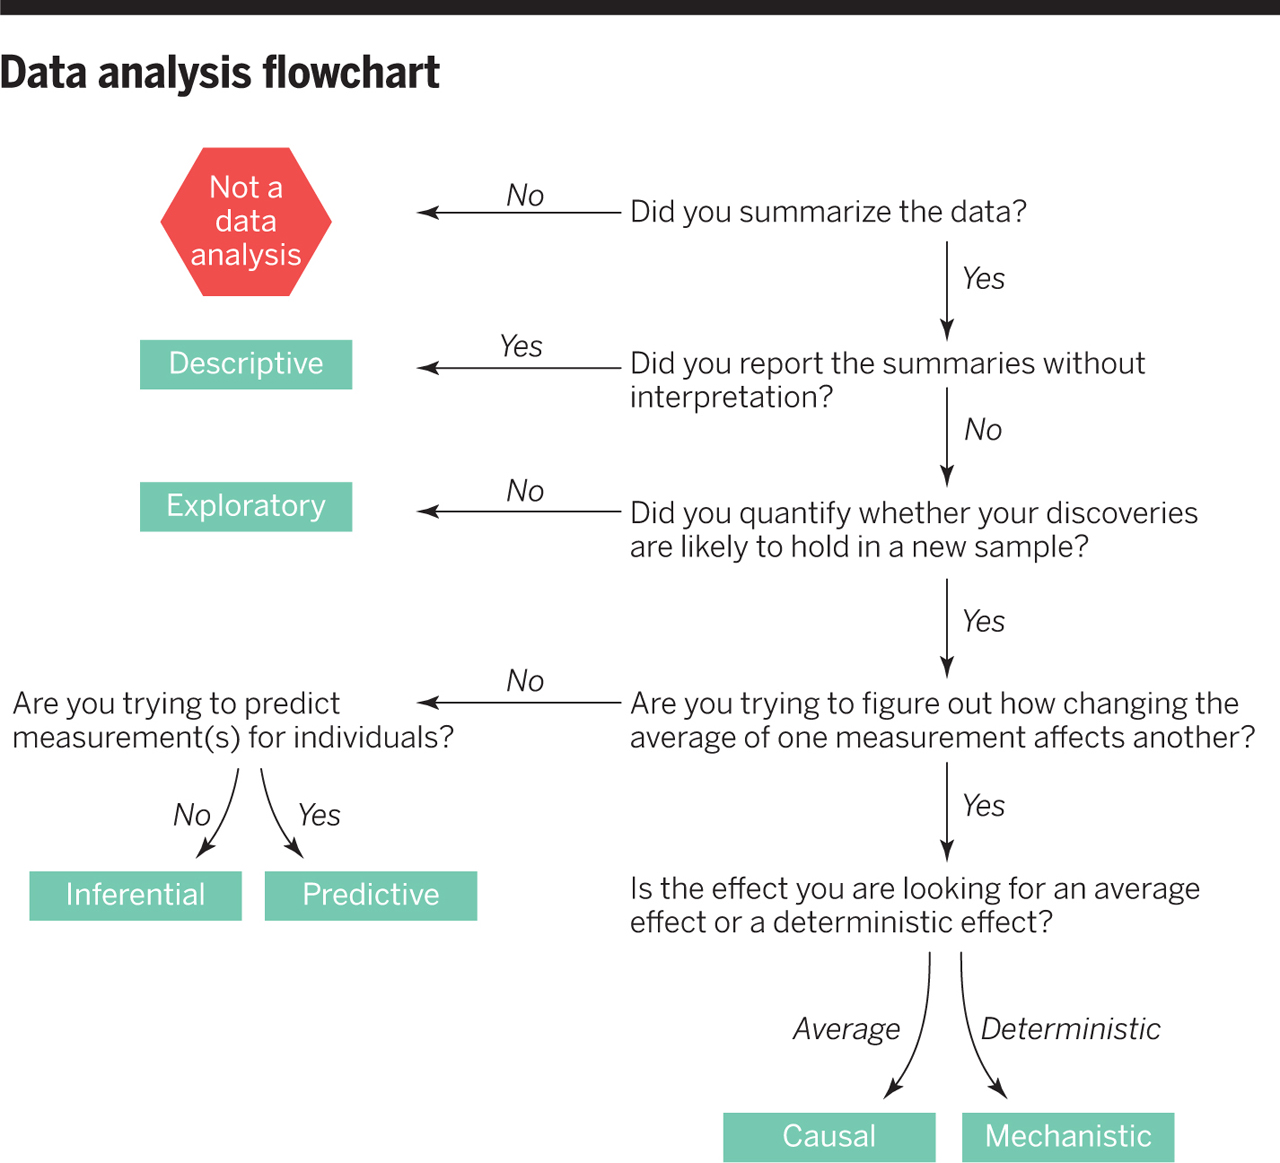
Six types of questions
- Descriptive: summarize a characteristic of data
- Exploratory: analyze to see if there are patterns, trends, or relationships between variables (hypothesis generating)
- Inferential: analyze patterns, trends, or relationships in representative data from a population
- Predictive: make predictions for individuals or groups of individuals
- Causal: whether changing one factor will change another factor, on average, in a population
- Mechanistic: explore “how” as opposed to whether
What are good questions?
A good question
- is not too broad (but also not too specific)
- can be answered (or at least approached) with data
- call for one of the different types of data analysis:
- descriptive
- exploratory
- inferential
- predictive
- (causal or mechanistic – not the typical choices for a short term data analysis projects. They should not be central but may be touched.)
Tools and advice for questions
Descriptive
- What is an observation?
- What are the variables?
- Summary statistics and basic visualizations
- Category frequencies and numerical distributions
Exploratory
- Questions specific to the topic
- Compute/summarize relevant variables: percentages, ratios, differences, …)
- Scatter plots
- Correlations
- Cluster Analysis
- Crafted computations and visualizations for your particular questions
Tools and advice for questions
Inferential
- Describe the population the data represents
- Can it be considered a random sample?
- Think theoretically about variable selection and data transformations
- Interpret coefficients of models
- Be careful interpreting coefficients when variables are highly correlated
- Check sensible interactions
- Are effects statistical significant?
- If you test hypothesis: Describe the null distribution
Predictive
- Do you have a regression or a classification problem?
- Do a train/test split (Optional, do crossvalidation) to evaluate your model performance
- Select sensible performance metrics for the problem (from the confusion matrix or regression metrics)
- Maybe compare different models and tune hyperparameters
- Do feature selection and engineering to improve the performance
Example questions
Political Attitudes
- How are attitudes correlated different in different European countries?
- How does the PCA of political attitudes changes over time in a country when computed for different waves?
- How well can party support be predicted for other European countries?
Fuel Watch
- How can we automatically quantify the different price politics of petrol stations (weekly oscillation, follow the oil price, fixed price, are there more)?
- Are there regional patterns in the price politics? Where do petrol stations use the weekly oscillation?
- What is associated with the highest prices?
- How do the prices exactly follow the crude oil price? (Find and merge data about the crude oil price.)
Example questions
COVID-19 Cases and Deaths
- Did new cases in the first wave show similar exponential growth growth rates in different countries?
- How did the relation between new cases and deaths change from wave to wave?
- How are world development indicators associated to the number of total deaths per million in a country?
Housing
- How much can we improve house price predictions by using decision trees and random forests?
- How can we make use of the spatial information to engineer features to improve the prediction?
Probability for Data Science
Probability Topics for Data Science
- The concept of probability and the relation to statistics and data
- Probability: Given a probabilistic model, what data will we see?
What footprints does the animal leave?
- Statistics: Given data, what probabilistic model could produce it?
What animal could have left these footprints?
- Probability: Given a probabilistic model, what data will we see?
- Probabilistic simulations
- Resampling: Bootstrapping (p-values, confidence intervals), cross-validation
- The confusion matrix: Conditional probabilities and Bayes’ theorem
- Sensitivity, specificity, positive and negative predictive value
- Random variables: A probabilistic view on variables in a data frame
- Modeling distributions of variables: The concepts of discrete and continuous probability distributions.
- The central limit theorem or why the normal distribution is so important.
What is probability
- One of the most successful mathematical models used in many domains.
- We have a certain intuition of probability visible in sentences like: “That’s not very probable.” or “That is likely.”
- A simplified but formalized way to think about uncertain events.
- Two flavors: Objective (Frequentist) or Subjective (Bayesian) probability.
- Objective interpretation: Probability is relative frequency in the limit of indefinite sampling. Long run behavior of non-deterministic outcomes.
- Subjective interpretation: Probability is a belief about the likelihood of an event.
- Related to data:
- Frequentist philosophy: The parameters of the population we sample from are fixed and the data is a random selection.
- Bayesian philosophy: The data we know is fixed but the parameters of the population are random and associated with probabilities.
Events as subsets of a sample space
Sample space, atomic events, events
In the following, we say \(S\) is the sample space which is a set of atomic events.
Example for sample spaces:
- Coin toss: Atomic events \(H\) (HEADS) and \(T\) (TAILS), sample space \(S = \{H,T\}\).
- Selection person from a group of \(N\) individuals labeled \(1,\dots,N\), sample space \(S = \{1,\dots,N\}\).
- Two successive coin tosses: Atomic events \(HH\), \(HT\), \(TH\), \(TT\); sample space \(S = \{HH,HT, TH, TT\}\). Important: Atomic events are not just \(H\) and \(T\).
- COVID-19 Rapid Test + PCR Test for confirmation: Atomic events true positive \(TP\) (positive test confirmed), false positive \(FP\) (positive test not confirmed), false negative \(FN\) (negative test not confirmed), true negative \(TN\) (negative test confirmed), sample space \(S = \{TP, FP, FN, TN\}\).
An event \(A\) is a subset of the sample space \(A \subset S\).
Important: Atomic events are events but not all events are atomic.
Example events for one coin toss
- The set with one atomic event is a subset \(\{H\} \subset \{H,T\}\).
- Also the sample space \(S = \{H,T\} \subset \{H,T\}\) is an event. It is called the sure event.
- Also the empty set \(\{\} = \emptyset \subset \{H,T\}\) is an event. It is called the impossible event.
- Interpretation:
- Event \(\{H,T\}\) = “The coin comes up HEAD or TAIL.”
- Event \(\{\}\) = “The coin comes up neither HEADS nor TAILS.”
Two coin tosses:
- Event \(\{HH, TH\}\) = “The first toss comes up HEAD or TAIL and the second is HEADS.”
- Event \(\{HT, TH, HH\}\) = “We have HEAD once or twice and it does not matter what coins.”
- The event \(\{TT, HH\}\) = “Both coins show the same side.”
Questions for three coin tosses
- “The coins show one HEAD” = \(\{HTT, THT, TTH\}\)
- “The first and the third coin are not HEAD?” = \(\{THT, TTT\}\)
- How many atomic events exist for three coin tosses? \(2^3=8\)
For selecting one random person:
Event \(\{2,5,6\}\) = The selected person is either 2, 5, or 6.
(Not all three people which is a different random variable!)
For COVID-19 testing:
- Event \(\{TP, FP\}\) = The test is positive.
- Event \(\{TN, FP\}\) = The person does not have COVID-19.
- Event \(\{TP, TN\}\) = The rapid test delivers the correct result.
The set of all events and the probability function
The set of all events
- The set of all events is the set of all subsets of a sample space \(S\).
- When the sample space has \(n\) atomic events, the set of all events has \(2^n\) elements.
- The set of all events is very large also for fairly simple examples!
Examples
- For 3 coin tosses: How many events exist? \(2^3=8\) atomic events \(\to\) \(2^8=256\) event
- How is it for four coin tosses? \(2^{(2^4)} = 65536\)
- Select two out of five people (without replacement)1?
Ten atomic events: 12, 13, 14, 15, 23, 24, 25, 34, 35, 45. Events: \(2^{10} = 1024\)
Probability function
Definition: A set of all events a function \(\text{Pr}: \text{Set of all subsets of $S$} \to \mathbb{R}\) is a probability function when
- The probability of any event is between 0 and 1: \(0\leq \text{Pr}(A) \leq 1\). (So, actually a probability function is a function into the interval \([0,1]\).)
- The probability of the event coinciding with the whole sample space (the sure event) is 1: \(\text{Pr}(S) = 1\).
- For events \(A_1, A_2, \dots, A_n\) which are pairwise disjoint we can sum up their probabilities:
\[\text{Pr}(A_1 \cup A_2\cup\dots\cup A_n) = \text{Pr}(A_1) + \text{Pr}(A_2) + \dots + \text{Pr}(A_n) \]
This captures the essence of how we think about probabilities mathematically. Most important: We can only easily add probabilities when they do not share atomic events.
Example Probability Function
Example coin tosses: We can define a probability function \(\text{Pr}\) by assigning the same probability to each atomic event.
- \(\text{Pr}(\{H\}) = \text{Pr}(\{T\}) = 1/2\)
- \(\text{Pr}(\{HH\}) = \text{Pr}(\{HT\}) = \text{Pr}(\{TH\}) = \text{Pr}(\{TT\}) = 1/4\)
So, the probability one or zero HEADs is \(\text{Pr}(\{HT, TH, TT\}) = \text{Pr}(\{HT\}) + \text{Pr}(\{TH\}) + \text{Pr}(\{TT\}) = \frac{3}{4}\).
Example selection of two out of five people: We can define a probability function \(\text{Pr}\) by assigning the same probability to each atomic event.
- \(\text{Pr}(\{12\}) = \text{Pr}(\{13\}) = \dots = \text{Pr}(\{45\}) = 1/10\).
So, the probability that 1 is among the selected \(\text{Pr}(\{12, 13, 14, 15\}) = \frac{4}{10}\).
Some basic probability rules
We can compute the probabilities of all events by summing the probabilities of the atomic events in it. So, the probabilities of the atomic events are building blocks for the whole probability function.
\(\text{Pr}(\emptyset) = 0\)
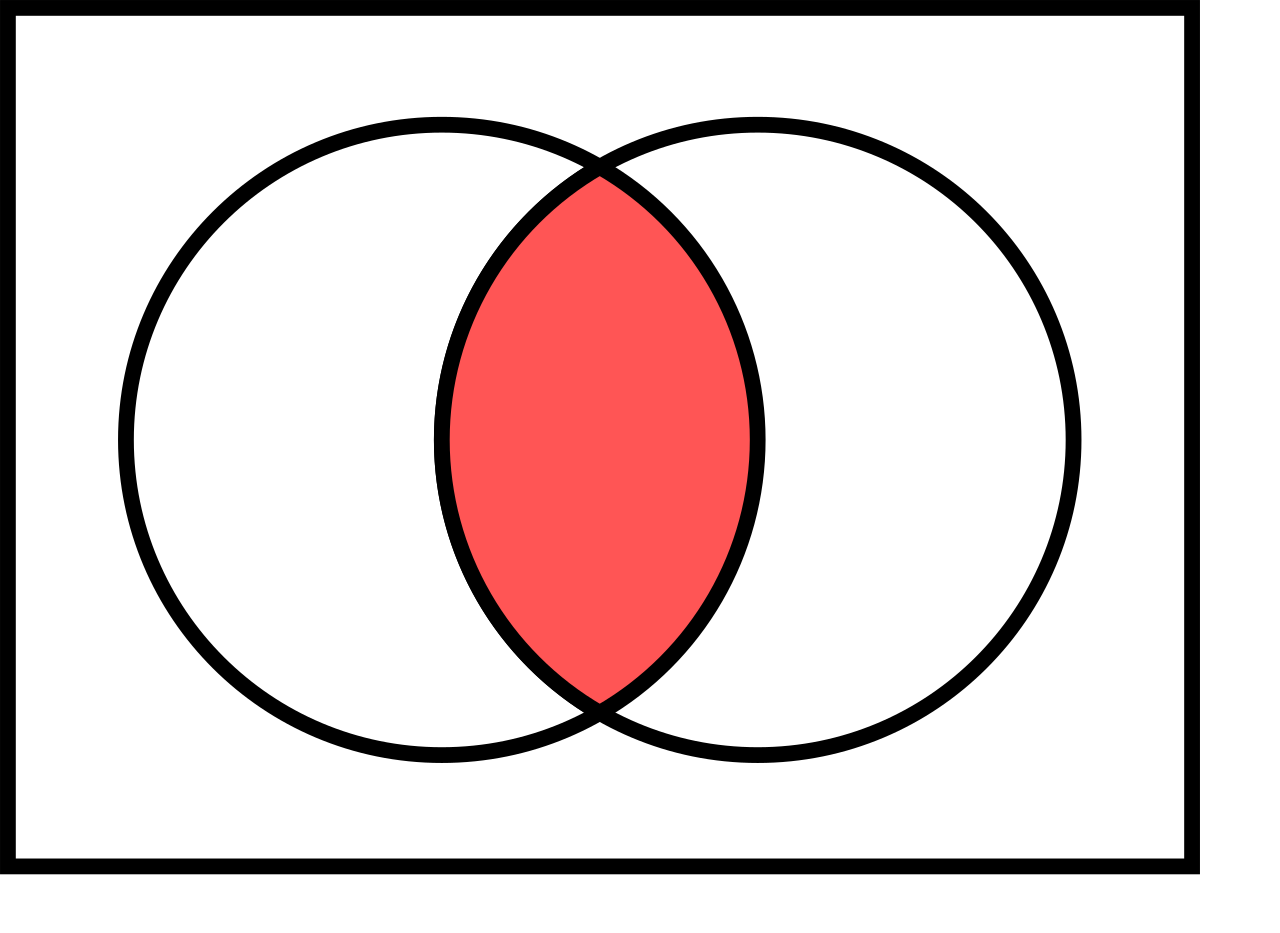
For any events \(A,B \subset S\) it holds
- \(\text{Pr}(A \cup B) = \text{Pr}(A) + \text{Pr}(B) - \text{Pr}(A \cap B)\)
- \(\text{Pr}(A \cap B) = \text{Pr}(A) + \text{Pr}(B) - \text{Pr}(A \cup B)\)
- \(\text{Pr}(A^c) = 1 - \text{Pr}(A)\)


Recap from the motivation of logistic regression: When the probability of an event is \(A\) is \(\text{Pr}(A)=p\), then its odds (in favor of the event) are \(\frac{p}{1-p}\). The logistic regression model “raw” predictions are log-odds \(\log\frac{p}{1-p}\).
Conditional probability
Definition: The conditional probability of an event \(A\) given an event \(B\) (write “\(A | B\)”) is defined as
\[\text{Pr}(A|B) = \frac{\text{Pr}(A \cap B)}{\text{Pr}(B)}\]
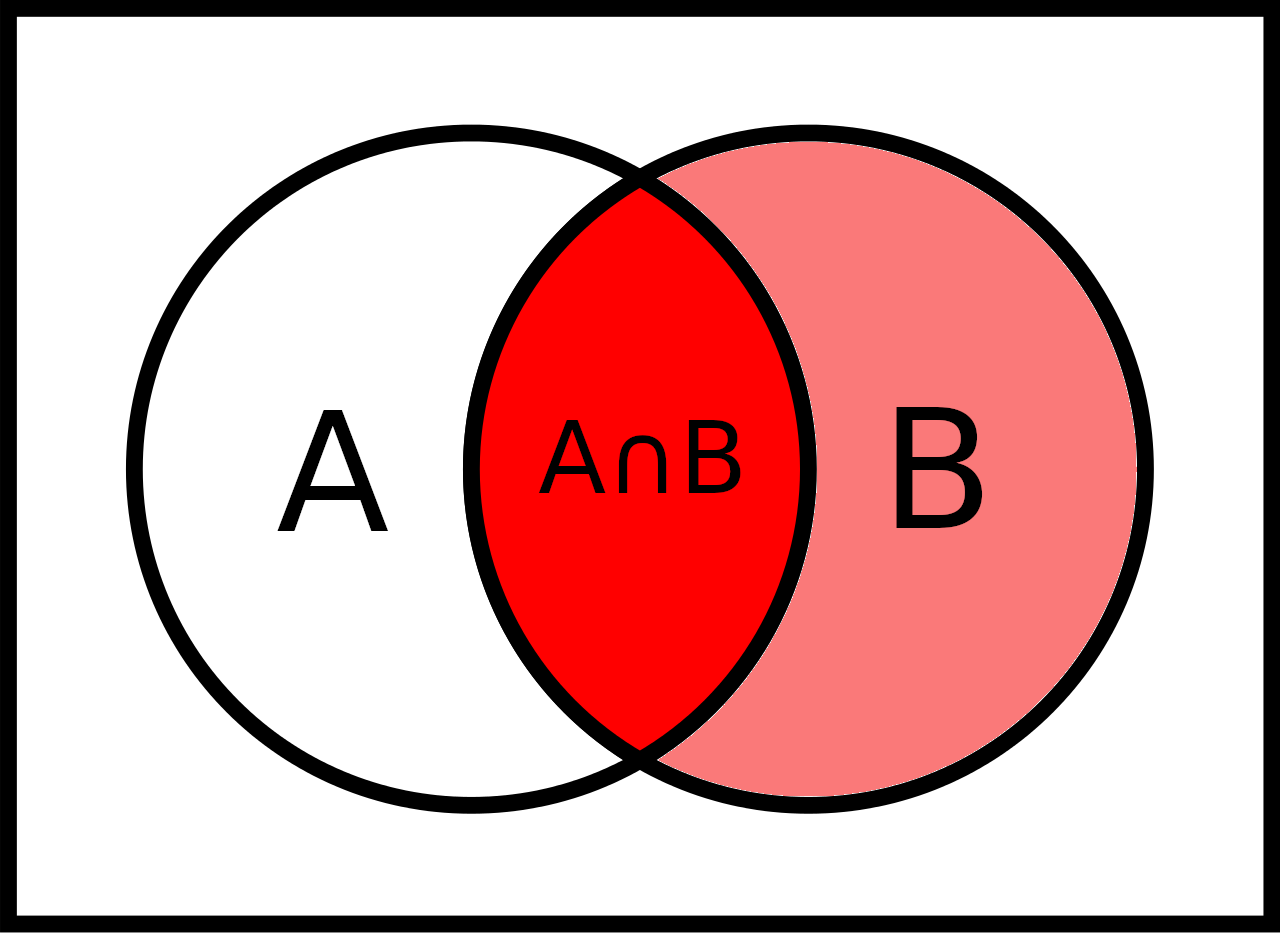
We want to know the probability of \(A\) given that we know that \(B\) has happened (or is happening for sure).
Two coin flips: \(A\) = “first coin is HEAD”, \(B\) = “one or zero HEADS in total”. What is \(\text{Pr}(A|B)\)? \(A\) = {HH, HT}, \(B\) = {TT, HT, TH} \(\to\) \(A \cap B = \{HT\}\)
\(\to\) \(\text{Pr}(A\cap B) = \frac{3}{4}\), \(\text{Pr}(A\cap B) = \frac{1}{4}\)
\(\to\) \(\text{Pr}(A|B) = \frac{1/4}{3/4} = \frac{1}{3}\)
More examples of conditional probability
COVID-19 Example: What is the probability that a random person in the tested sample has COVID-19 (event \(P\) “positive”) given that she has a positive test result (event \(PP\) “predicted positive”)?
\[\text{Pr}(P|PP) = \frac{\text{Pr}(P \cap PP)}{\text{Pr}(PP)}\]
Definition p-value: Probability of observed or more extreme outcome given that the null hypothesis (\(H_0\)) is true.
\[\text{p-value} = \text{Pr}(\text{observed or more extreme outcome for test-statistic} | H_0)\]
Probability in the Confusion Matrix
Confusion Matrix
Confusion matrix of statistical classification, large version:
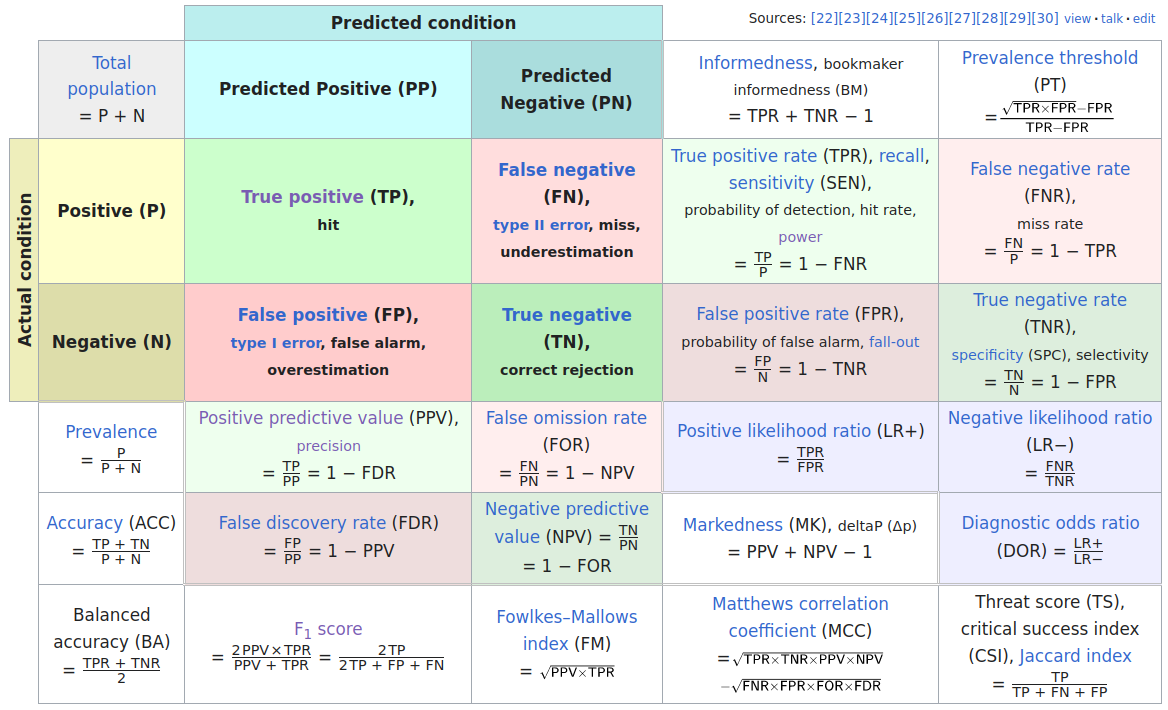
4 probabilities in confusion matrix
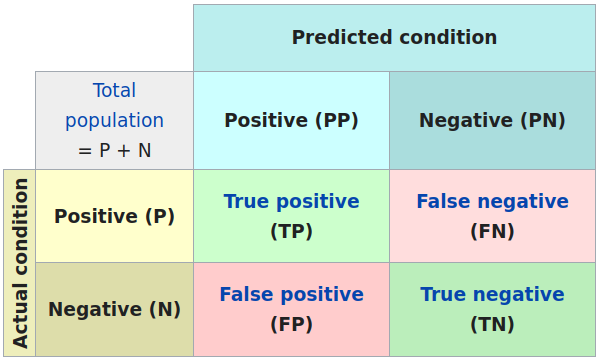
Sensitivity and Specificity
\(\to \atop \ \) Sensitivity is the true positive rate: TP / (TP + FN)
\(\ \atop \to\) Specificity is the true negative rate: TN / (TN + FP)
Positive/negative predictive value
\(\scriptsize\downarrow \ \) Positive predictive value: TP / (TP + FP)
\(\scriptsize\ \downarrow\) Negative predictive value: TN / (TN + FN)
Here TP, TN, FP, FN are the numbers of true positives, true negatives, false positives, and false negatives.
As the set of atomic events \(\{TP\}, \{FP\}, \{FN\}, \{TN\}\) we can define the probabilities of the events like \(\text{Pr}(\{TP\}) = \frac{TP}{N}\) with \(N = TP + FP + FN + TN\).
… as conditional probabilities
Sensitivity and specificity are conditional probabilities:
Sensitivity is the probability of a positive test result given that the person has the condition: \(\text{Pr}(PP|P) = \frac{TP}{TP + FN}\)
Specificity is the probability of a negative test result given that the person does not have the condition: \(\text{Pr}(PN|N) = \frac{TN}{TN + FP}\)
Positive predictive value is the probability of the condition given that the test result is positive: \(\text{Pr}(P|PP) = \frac{TP}{TP + FP}\)
Negative predictive value is the probability of the condition given that the test result is negative: \(\text{Pr}(N|PN) = \frac{TN}{TN + FN}\)
Note: The positive predictive value \(\text{Pr}(P|PP)\) is sensitivity \(\text{Pr}(PP|P)\) with “flipped” conditionality.
Bayes’ Theorem
Bayes’ Theorem is a fundamental theorem in probability theory that relates the conditional probabilities \(\text{Pr}(A|B)\) and \(\text{Pr}(B|A)\) to the marginal probabilities \(\text{Pr}(A)\) and \(\text{Pr}(B)\):
\[\text{Pr}(A|B) = \frac{\text{Pr}(B|A) \cdot \text{Pr}(A)}{\text{Pr}(B)}\]
Example: What is the probability that a random person in the tested sample has COVID-19 (\(P\) = positive) given that she has a positive test result (\(PP\) = predicted positive)?
\[\text{Pr}(P|PP) = \frac{\text{Pr}(PP|P) \cdot \text{Pr}(P)}{\text{Pr}(PP)}\] So, we can compute the positive predictive value \(\text{Pr}(P|PP)\) from the sensitivity \(\text{Pr}(PP|P)\) and the rate (or probability) of positive conditions \(\text{Pr}(P)\) and the rate (or probability) of positive tests.
Prevalence
- The rate (or probability) of the positive conditions in the population is also called Prevalence:
\[\text{Pr}(P) = \frac{P}{N} = \frac{TP + FN}{N}\]
Sensitivity and Specificity are properties of the test (or classifier) and are independent of the prevalence of the condition in the population of interest.
The Positive/Negative Predictive Values are not!
How the positive predictive value (PPV) depends on prevalence
We assume a test with sensitivity 0.9 and specificity 0.99. \(N = 1000\) people were tested.
| PP | PN | |
|---|---|---|
| P | TP | FN |
| N | FP | TN |
Sensitivity = TP / P
Specificity = TN / N
PPV = TP / PP
Prevalence = P / N
Prevalence = 0.1
\(P\) = 100 \(N\) = 900
| PP | PN | |
|---|---|---|
| P | 90 | 10 |
| N | 9 | 891 |
PPV = 90 / (90 + 9) = 0.909
From the positive tests 90.9% have COVID-19.
Prevalence = 0.01
\(P\) = 10 \(N\) = 990
| PP | PN | |
|---|---|---|
| P | 9 | 1 |
| N | 9.9 | 980.1 |
PPV = 9 / (9 + 9.9) = 0.476
From the positive tests only 47.6% have COVID-19!

